| AIM Radiant Heating |
Cairo |
Industrial |
| Amerigas |
Athens |
Utility |
| Armstrong’s Elk Farm |
Cornwallville |
Tourism Attraction |
| Ashland Mountain House |
Ashland |
Tourism Lodging |
| Athens Generating Co. |
Athens |
Utility |
| Baliwick Ranch |
Catskill |
Tourism Attraction |
| Bavarian Manor Country Inn |
Purling |
Tourism |
| Beds On Clouds B&B |
Windham |
Tourism Lodging |
| B&B Lounge |
Catskill |
Tourism Lodging |
| Best Western New Baltimore Inn |
West Coxsackie |
Tourism Lodging |
| Blackhead Mountain Lodge & Country Club |
Cairo |
Tourism Lodging |
| Black Bear Lodge |
Lexington |
Tourism Lodging |
| Blackhorse Farms |
Athens |
Agriculture/Retail |
| Blackthorne Resort |
East Durham |
Tourism Lodging |
| Boat N RV Warehouse |
Coxsackie |
Retail |
| Bridge Street Theater |
Catskill |
Tourism Attraction |
| Brookside B&B |
Haines Falls |
Tourism Lodging |
| Captain’s Inn Point Lookout |
East Windham |
Tourism Lodging |
| Carriage House B&B |
East Durham |
Tourism Lodging |
| Catskill Golf Resort |
Catskill |
Tourism Attraction |
| Catskill Inn |
Catskill |
Tourism Lodging |
| Catskill Lodge |
Windham |
Tourism Lodging |
| Catskill Motor Court |
Catskill |
Tourism Lodging |
| Catskill Mountain Lodge |
Palenville |
Tourism Lodging |
| Catskill Mountain Housing Development Corp. |
Catskill |
Housing |
| Catskill Transmission |
Catskill |
Service |
| Catskill Stream B&B |
Palenville |
Tourism Lodging |
| Cave Mountain Motel |
Windham |
Tourism Lodging |
| Cave Mountain Brewing Co. |
Windham |
Manufacturer/Retail |
| CA Albright & Sons |
New Baltimore |
Service/Distribution |
| Colonial Golf Course |
Tannersville |
Tourism Attraction |
| Country Place Resort |
East Durham |
Tourism Lodging |
| Country Suite B&B |
Windham |
Tourism Lodging |
| Creekside Acres |
Cairo |
Tourism Lodging |
| Crystal Brook Resort |
Round Top |
Tourism Lodging |
| Cuomo’s Cove |
Windham |
Tourism Lodging |
| Curran’s Suites |
Haines Falls |
Tourism Lodging |
| Deer Mountain Inn |
Tannersville |
Tourism Lodging |
| Deer Watch Inn |
East Durham |
Tourism Lodging |
| Eastwind |
Windham |
Tourism Lodging |
| EmUrgent Care |
Various |
Service |
| Fairlawn Inn |
Hunter |
Tourism Lodging |
| Gallery Inn Catskills |
Durham |
Tourism Lodging |
| Garrison Fire & Rescue |
Palenville |
Industrial |
| Gavin’s Golden Hill Resort |
Cornwallville |
Tourism Lodging |
| George Ellen |
Round Top |
Tourism Lodging |
| Gerhard Guitarworks |
Windham |
Manufacturer |
| Glen Falls House |
Round Top |
Tourism Lodging |
| Greene County Council on the Arts |
Catskill |
Tourism Attraction |
| Greene County Historical Society |
Coxsackie |
Tourism Attraction |
| Greene Mountain View Inn |
Tannersville |
Tourism Lodging |
| Greenville Arms 1889 Inn |
Greenville |
Tourism Lodging |
| Hamilton Hotel |
Windham |
Tourism Lodging |
| High Peak Motel |
Haines Falls |
Tourism Lodging |
| Hillside Mountain Inn |
Windham |
Tourism Lodging |
| Hinterland Design |
Coxsackie |
Service |
| Hectar Holding Company |
New Baltimore |
Service |
| Holiday Inn Express |
West Coxsackie |
Tourism Lodging |
| Hollowbrook Inn & Restaurant |
Greenville |
Tourism Lodging |
| Hotel Vienna |
Windham |
Tourism Lodging |
| Hull-O-Farms |
Durham |
Tourism Lodging |
| Hunter Inn |
Hunter |
Tourism Lodging |
| Hunter Wellness Retreat |
Hunter |
Tourism Lodging |
| Island Green Golf Course |
Greenville |
Tourism Lodging/Attraction |
| Intelligent Technology Solutions |
Coxsackie |
Service |
| Jimmy O’Connor’s |
Windham |
Tourism Lodging |
| Jim’s Great American |
Prattsville |
Retail |
| Kaaterskill Associates |
Cairo |
Service |
| Kaatskill Mountain Club |
Hunter |
Tourism Lodging |
| KathodeRay Media |
Catskill |
Media Consultants |
| Kelly Acres |
Windham |
Tourism Lodging |
| Kilcar Hotel |
Greenville |
Tourism Lodging |
| Mansion & Reed Guest House |
Coxsackie |
Tourism Lodging |
| Martinez Auto Body Shop, Inc. |
Coxsackie |
Service |
| McGrath’s Motel |
East Durham |
Tourism Lodging |
| Matter Contracting |
Coxsackie |
Manufacturer |
| Mavis Discount Tire |
Catskill |
Retail |
| Michael Dee’s Motel |
East Durham |
Tourism Lodging |
| Moore’s Motel |
Prattsville |
Tourism Lodging |
| Mountain Meadow Inn |
Lexington |
Tourism Lodging |
| Mountain Top Arboretum |
Tannersville |
Tourism Attraction |
| Mountain Top Historical Society |
Haines Falls |
Tourism Attraction |
| Mountain Trails XC Ski & Snowshoe Center |
Tannersville |
Tourism Attraction |
| Mountain Treasure Inn |
Maplecrest |
Tourism Lodging |
| NAPA Auto Parts |
Various |
Wholesale/Retail |
| Needles In the Haystack |
Oak Hill |
Tourism Lodging |
| New York Springwater |
Halcott |
Manufacturer |
| NYMD Green Lake Resort |
Catskill |
Tourism Lodging |
| Orpheum Theater and Performing Arts Center |
Tannersville |
Tourism Attraction |
| Pattison, Koskey, Howe & Bucci, CPAs, P.C. |
Catskill |
Service |
| Peloke’s Motel |
Catskill |
Tourism Lodging |
| Penske |
Coxsackie |
Service |
| Piano Performance Museum |
Hunter |
Tourism Attraction |
| Pine Lake Manor |
Greenville |
Tourism Lodging |
| Pine Ridge Farm |
Greenville |
Tourism Lodging |
| Pioneer Bank |
Cairo |
Service |
| Prattsville Art & Residency Center |
Prattsville |
Tourism Attraction |
| Quikcrete |
New Baltimore |
Manufacturer/Wholesale/Retail |
| Red Carpet Inn |
West Coxsackie |
Tourism Lodging |
| Red Ranch Motel |
Catskill |
Tourism Lodging |
| Reidlbauer’s Resort |
Round Top |
Tourism Lodging |
| Rip Van Winkle Brewing |
Catskill |
Service/Retail Brewing |
| Rip Van Winkle Country Club |
Palenville |
Tourism Attraction |
| Rip Van Winkle Motor Lodge |
Leeds |
Tourism Lodging |
| RC Lacy |
Catskill |
Retail |
| Royal Metal Products |
Greenville |
Industrial |
| Rose Motel |
Durham |
Tourism Lodging |
| Roseberry’s Inn |
Hunter |
Tourism Lodging |
| Rosehaven Inn |
Haines Falls |
Tourism Lodging |
| Ross Site Development |
Coxsackie |
Manufacturer |
| Roundtopia Mountain Bike Center |
Round Top |
Tourism Attraction |
| Ruby’s Hotel |
Freehold |
Tourism Lodging |
| Salon 255 |
Coxsackie |
Service/Retail |
| Sawyer Chevrolet |
Catskill |
Retail |
| Sedgwick House |
Hunter |
Tourism Lodging |
| Shamrock House |
East Durham |
Tourism Lodging |
| Shinglekill Falls B&B |
Acra |
Tourism Lodging |
| Simply Durham Cottages |
East Durham |
Tourism Lodging |
| Snowed Inn B&B |
Tannersville |
Tourism Lodging |
| Spruceton Inn |
West Kill |
Tourism Lodging |
| Stack’s Lamp Post Motel |
Cairo |
Tourism Lodging |
| State Telephone |
Coxsackie |
Utility |
| Stewart House at the Athens Hotel |
Athens |
Tourism Lodging |
| Story Farms |
Catskill |
Agriculture/Retail |
| Story’s Nursery |
Freehold |
Wholesale/Retail |
| Subversive |
Catskill |
Wholesale/Retail Brewing |
| Sugar Maples Center for the Creative Arts |
Maplecrest |
Tourism Attraction |
| Sun View Hotel |
Tannersville |
Tourism Lodging |
| Supersonic Speedway |
East Durham |
Tourism Attraction |
| Swiss Chalet |
Tannersville |
Tourism Lodging |
| The Inn at Hill Crest Manor |
Cairo |
Tourism Lodging |
| The Kaaterskill |
Catskill |
Tourism Lodging |
| The Lumberyard |
Catskill |
Tourism Attraction |
| The Mountain Brook |
Tannersville |
Tourism Lodging |
| The Terrace |
Cairo |
Tourism Lodging |
| Thomas Cole National Historic Site |
Catskill |
Tourism Attraction |
| Thompson House |
Windham |
Tourism Lodging |
| Thorpe GMC |
Haines Falls |
Retail |
| Thunderhart Hotel & Golf Course |
Greenville |
Tourism Lodging/Attraction |
| Tip Top Furniture |
Freehold |
Retail |
| Trustco |
Catskill |
Service |
| Tumblin Falls House |
Purling |
Tourism Lodging |
| Twilight Lodge |
Haines Falls |
Tourism Lodging |
| Twin County Medical Associates |
Catskill |
Service |
| Washington Irving Inn |
Hunter |
Tourism Lodging |
| Weldon House & Motel |
East Durham |
Tourism Lodging |
| Willow Pond Motel |
Catskill |
Tourism Lodging |
| Windham Country Club |
Windham |
Tourism Attraction |
| Window Modes |
Durham |
Manufacturer |
| Winter Clove Inn |
Round Top |
Tourism Lodging |
| Winwood Inn & Condos |
Windham |
Tourism Lodging |
| Wolfgang B. Gourmet Foods |
Catskill |
Industrial |
| Wolf’s Maple Breeze |
Catskill |
Tourism Lodging |
| Young’s General Store |
Prattsville/Catskill |
Retail |
| Zaddock Pratt Museum |
Prattsville |
Tourism Attraction |

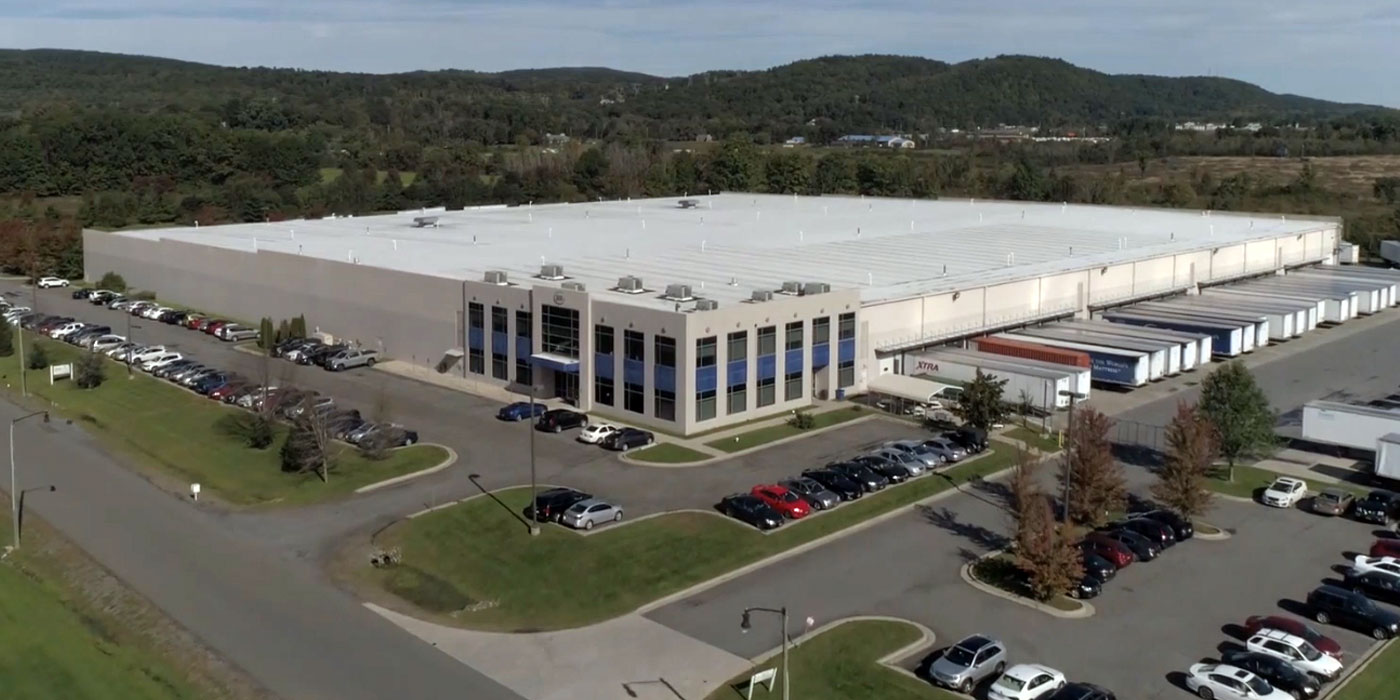

 Featured Commercial Properties Shovel-Ready Sites and Commercial Locations
 Economic Development Projects & Plans Plans and Execution Summaries with supporting data
 Our Creative Economy The growing industries in Greene County and the Hudson Valley